As representatives from H Company, the project goal is to analyze a chosen dataset and provide a hypothetical solution. In this case our group chose to analyze Traffic Accident Data from year 2020 in New York City. The data was made public on Kaggle.I personally made the backbone of the presentation, the basic problem definition and analysis as well as crafting the dashboard of the data.
Objective
Understanding the implementation of theoretical basic of Data Analytics into real life situation while positioning ourselves as members from consulting company.
Action
Researching and crafting hypotheses related to the dataset
Cleaning data using Excel/Spreadsheet
Using SQL to make analysis based on cleaned dataset
Creating Dashboard using Tableau Online
Composing flow of presentation for group mates to comfortably present result
Result
Creating professional deck where all the basic of analysis are implemented and using the proper tools or application to analyze and displaying the data in the form of dashboard.
Background
Even though pandemic happens in 2020, there is high the number of accidents happening around New
York City. Being able to respond and make a safer place for the residents and to figure out the cause
of accidents will be our goal in order to create a more safe environment for the residents of New York City.
Analysis
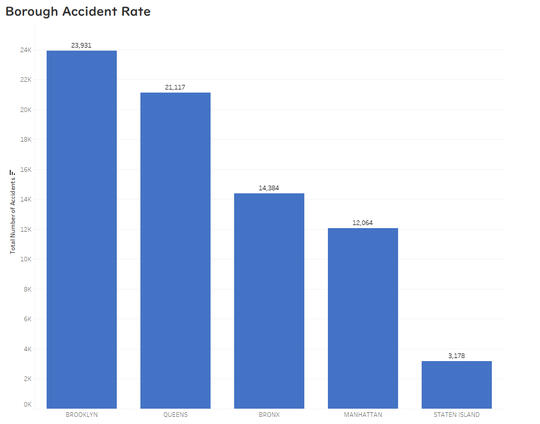
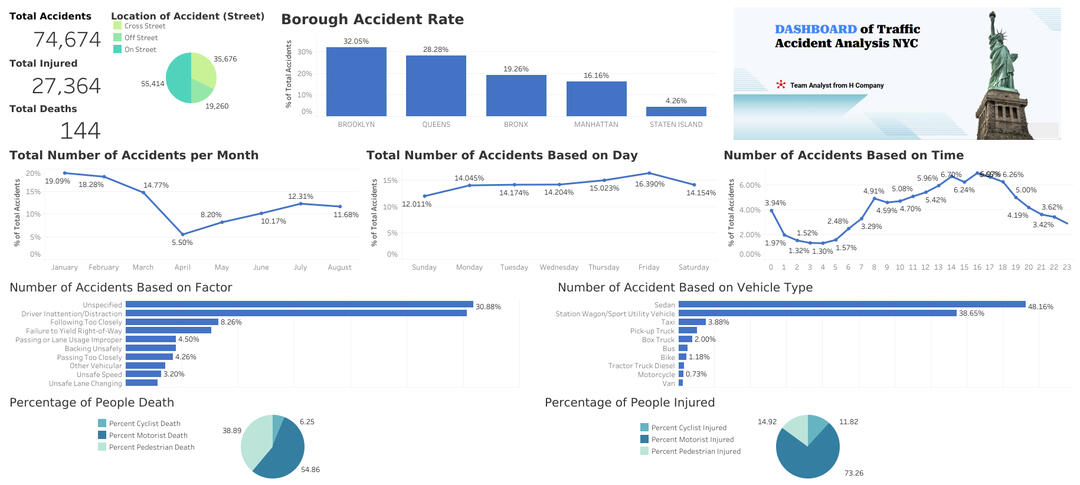
WHICH LOCATION HAS THE MOST NUMBER OF ACCIDENTS?The highest number of accidents recorded in 2020 happened in Brooklyn, where 32% of the population of New York City lives in.
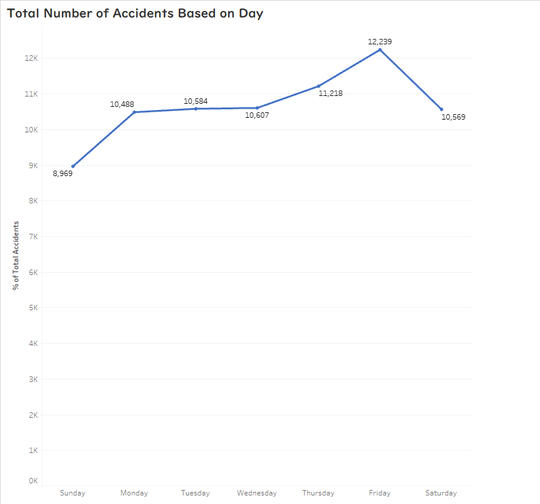
DOES THE DAY HAVE ANY CONTRIBUTION TO ACCIDENT RATE?Friday has the highest number of accidents, at a rate of nearly 17%. This is mostly due to people rushing home from work. Meanwhile the lowest number of accidents happens on Sunday, at a rate of 12%, and is due to presumably most people staying at home.
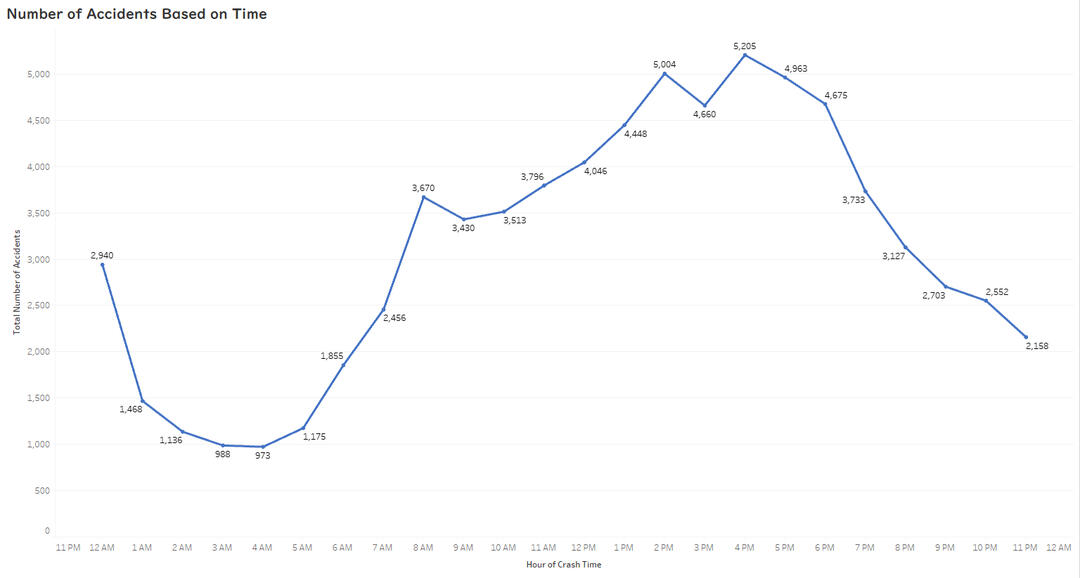
DOES TIME HAVE ANY EFFECTS ON ACCIDENT RATE?Most of the accidents happened after work hours (4 p.m.), and again is due to people start rushing home from work. Meanwhile during dawn hours, there are barely any human activities which is shown by low number of accidents.
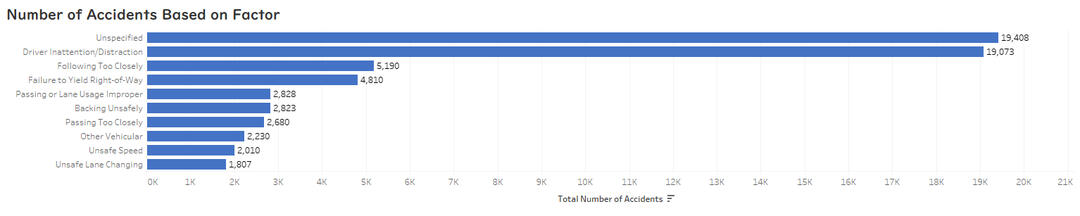
WHAT ARE THE CAUSES OF THE ACCIDENTS?Unfortunately, due to human error, most of the cause of accidents are labeled as Unspecified. Unspecified are the accidents where the witnesses are not able to provide the probable cause of the accidents or the officers failing to record the cause of accident itself. However, most of the accidents are caused by the fault of the driver and labeled as human error.
Proposed Solution
The solutions our team proposed are:
30% increase in security patrol of around Brooklyn and Queens area.
More attention of traffic arrangement around 12pm - 19pm, possible reduction of 6%.
Stricter punishment for traffic violation since 30% of the accident are caused by driver inattention.
Based on the analytics of the data, it is shown that most of the accident are caused by human error, of which there can never be a definite solution to solve it. The only possible solution is to minimize the cause of the problem, therefore the solutions above are proposed.
Dashboard
Click on the icons below to get a full overview of the project as well as live dashboard from Tableau Online.